
Greenhouse Gas Emission and Management
Nan Pao Resins is committed to achieving carbon neutrality by 2050. Using 2023 as the base year, the Company is progressively building and procuring renewable energy, promoting GHG reduction, and continuing to advance toward its long-term net zero goal. The 2023 Scope 1 and Scope 2 GHG inventory covered the Group's main chemical business plants, with third-party verification statements obtained as required. The goal is to complete GHG inventory and management for 100% of the Group's plants by 2028.
To strengthen carbon reduction management and accountability, Nan Pao formally incorporated environmental performance into the KPIs of senior managers starting in 2024. Using 2023 as the base year, the Company set an annual target of reducing GHG emission intensity by 10% from the base year in 2025, and continues to drive Group-wide GHG emission reductions through energy efficiency improvements, renewable energy adoption, and various carbon reduction measures.
| Greenhouse Gas Category | Target Value |
|---|---|
| Category 1 and 2 intensity | 10% lower than in 2023 |
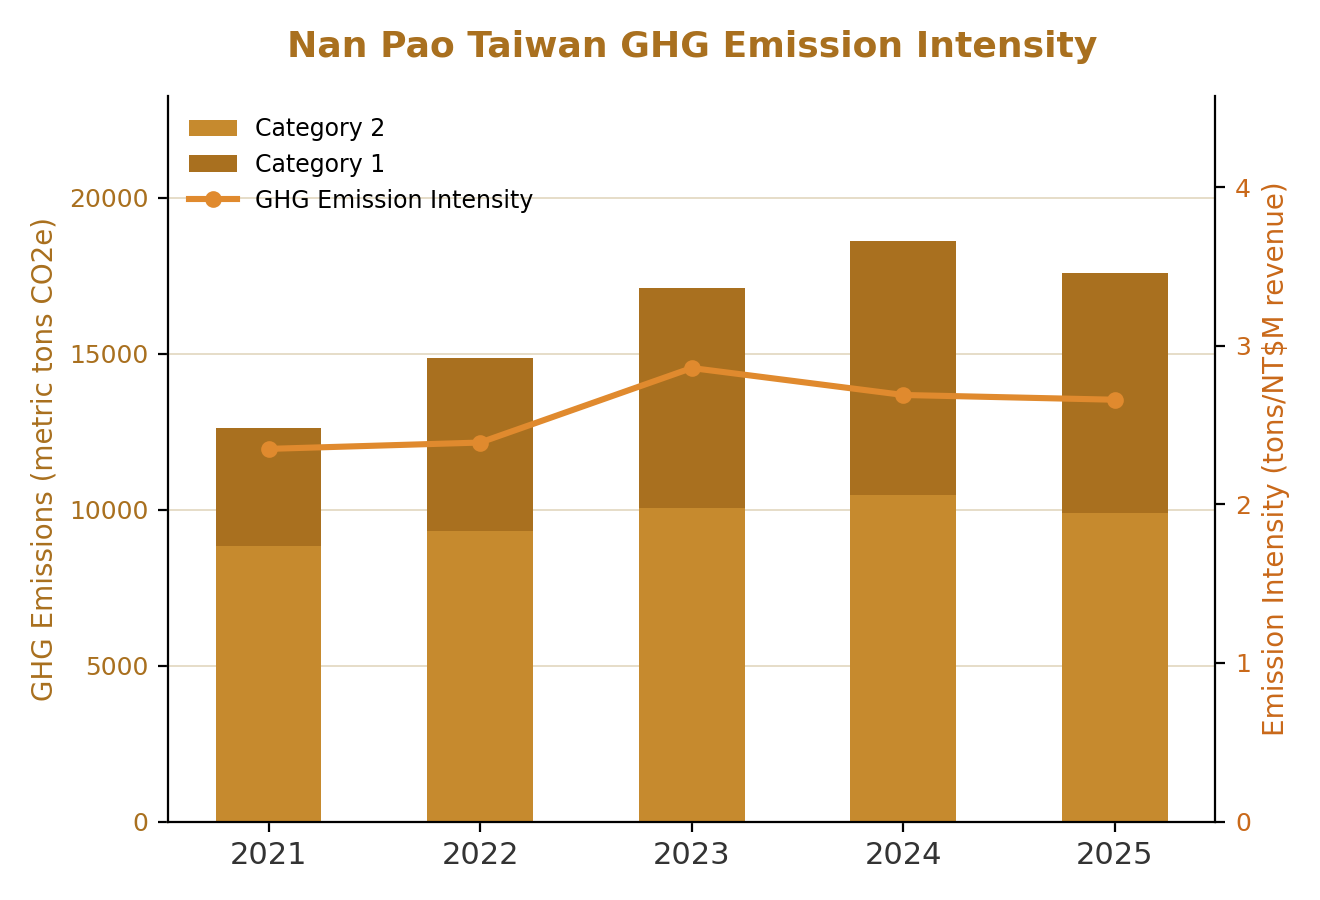
In 2025, Nan Pao Taiwan's Scope 1 (direct) emissions were 7,685.23 tCO₂e and Scope 2 (indirect emissions from purchased electricity) emissions were 9,891.17 tCO₂e, for combined Scope 1 and 2 emissions of 17,576.40 tCO₂e. On carbon reduction measures, the Company continued to pursue boiler energy-saving improvements and process optimization to reduce energy use and GHG emissions, while expanding solar installation capacity at its plants and promoting electricity conservation measures to progressively increase renewable energy use and energy efficiency.
In 2025, Nan Pao Taiwan's revenue excluding related parties was NT$6,596.16 million, and Scope 1 and 2 GHG emission intensity was 2.66, down 6.99% from 2.86 in the 2023 base year. Although 2025 emission intensity improved from the base year, the annual target of a 10% reduction from 2023 was not met. Driven primarily by changes in annual operational scale and energy demand, Nan Pao will continue to expand renewable energy installations at its plants, replace equipment with high-efficiency models, and deepen process heat integration to further improve energy efficiency and narrow the gap to the target.
In response to the launch of Taiwan's carbon fee system, Nan Pao has assessed the carbon fee impact on its Nan Pao Taiwan plants and, based on the carbon fee rates approved by the Ministry of Environment, incorporated the related costs into internal budget planning. Energy-saving improvements and renewable energy investments serve as the main fee reduction strategies, reducing the carbon fee burden and enhancing low-carbon operating capabilities by lowering energy use and GHG emissions.
Beyond Scope 1 and 2, Nan Pao continues to advance its inventory of Category 3 to Category 6 GHG emissions. The Company first identifies material emission sources and confirms their degree of impact on overall carbon emissions, then progressively conducts systematic inventory and data compilation. In 2025, the main emission source was upstream raw material use, particularly chemical raw materials with high emission factors. To reduce indirect emissions from raw material use, the R&D unit continues to develop low-carbon formulations, including reducing the solvent content of products and prioritizing recycled and bio-based raw materials, while continuously optimizing processes to reduce reliance on high-carbon raw materials, thereby lowering the full life cycle carbon footprint of products and strengthening carbon reduction across the supply chain.
| Nan Pao Taiwan | Foshan Nan Pao | Foshan Goodwill | Dongguan Nan Pao | Dongguan Jiaqin | Fuqing Nan Pao | Vietnam Nan Pao | Nan Pao Advanced Materials Vietnam | Nan Pao Materials Viet Nam | Nan Pao Indonesia | Chemicals Business Total | |
|---|---|---|---|---|---|---|---|---|---|---|---|
| Category 1 (metric tons CO₂e) | 7,685.23 | 847.08 | 1,796.61 | 384.51 | 9.97 | 54.67 | 870.15 | 1,121.27 | 119.32 | 227.50 | 13,116.31 |
| Category 2 (metric tons CO₂e) | 9,891.17 | 1,073.99 | 2,367.03 | 524.44 | 419.74 | 192.11 | 1,623.11 | 1,593.56 | 209.22 | 326.18 | 18,220.55 |
| Total Category 1 and 2 (metric tons CO₂e) | 17,576.40 | 1,921.07 | 4,163.64 | 908.95 | 429.71 | 246.78 | 2,493.26 | 2,714.83 | 328.54 | 553.68 | 31,336.86 |
| ISO 14064-1 verified | ● | ● | ● | ● | ● | Not yet verified | ● | ● | ● | ● | |
| Category 3 (metric tons CO₂e) | 1,418.60 | 4,058.45 | 10,738.16 | 856.07 | 184.39 | - | 769.26 | 423.76 | 676.36 | 310.99 | 19,436.04 |
| Category 4 (metric tons CO₂e) | 169,114.17 | 67,777.98 | 88,134.71 | 15,095.58 | 7,524.07 | - | 39,548.36 | 52,406.26 | 28,302.20 | - | 467,903.33 |
| Categories 1–4 total (metric tons CO₂e) | 188,109.17 | 73,757.50 | 103,036.51 | 16,860.60 | 8,138.17 | 246.78 | 42,810.88 | 55,544.85 | 29,307.10 | 864.67 | 518,676.23 |
| Category 5 (metric tons CO₂e) | - | - | 20,526.18 | - | - | - | - | - | - | - | 20,526.18 |
| Categories 1–5 total (metric tons CO₂e) | 188,109.17 | 73,757.50 | 123,562.69 | 16,860.60 | 8,138.17 | 246.78 | 42,810.88 | 55,544.85 | 29,307.10 | 864.67 | 539,202.41 |
Note 1: GHG emission factors used in this inventory are based primarily on the "Greenhouse Gas Emission Factor Management Table, Version 6.0.4" published by the Environmental Protection Administration, Executive Yuan.
Note 2: Global warming potential data from the Intergovernmental Panel on Climate Change (IPCC) Fifth Assessment Report (2013) is used as the basis for calculation.
Note 3: The Company uses the operational control approach to aggregate Scope 1 and Scope 2 GHG emissions across all production sites; the GHGs inventoried include carbon dioxide, methane, nitrous oxide, hydrofluorocarbons, perfluorocarbons, sulfur hexafluoride, and nitrogen trifluoride.
To ensure the completeness and credibility of Group GHG data, Nan Pao continues to promote GHG inventories and third-party external verification at each plant. The 2025 Group GHG inventory covered the main chemical business sites, of which 9 plants completed third-party external verification, covering approximately 67% of the Group's chemical business revenue excluding related parties. Fuqing Nan Pao completed its 2025 GHG inventory but did not obtain an external verification statement for the year; its inventory data is nonetheless included in the Group's 2025 GHG emission statistics.
As inventory and verification work for the year had not been completed at Kunshan Nan Pao, NNV Vietnam, and Nan Pao Thailand, their data is not included in the Group's 2025 GHG emission statistics. Nan Pao will continue to strengthen Group GHG data management and verification mechanisms, restore external verification coverage to 13 or more plants from 2026, and advance toward the goal of completing GHG inventory and external verification for all Group plants by 2028.
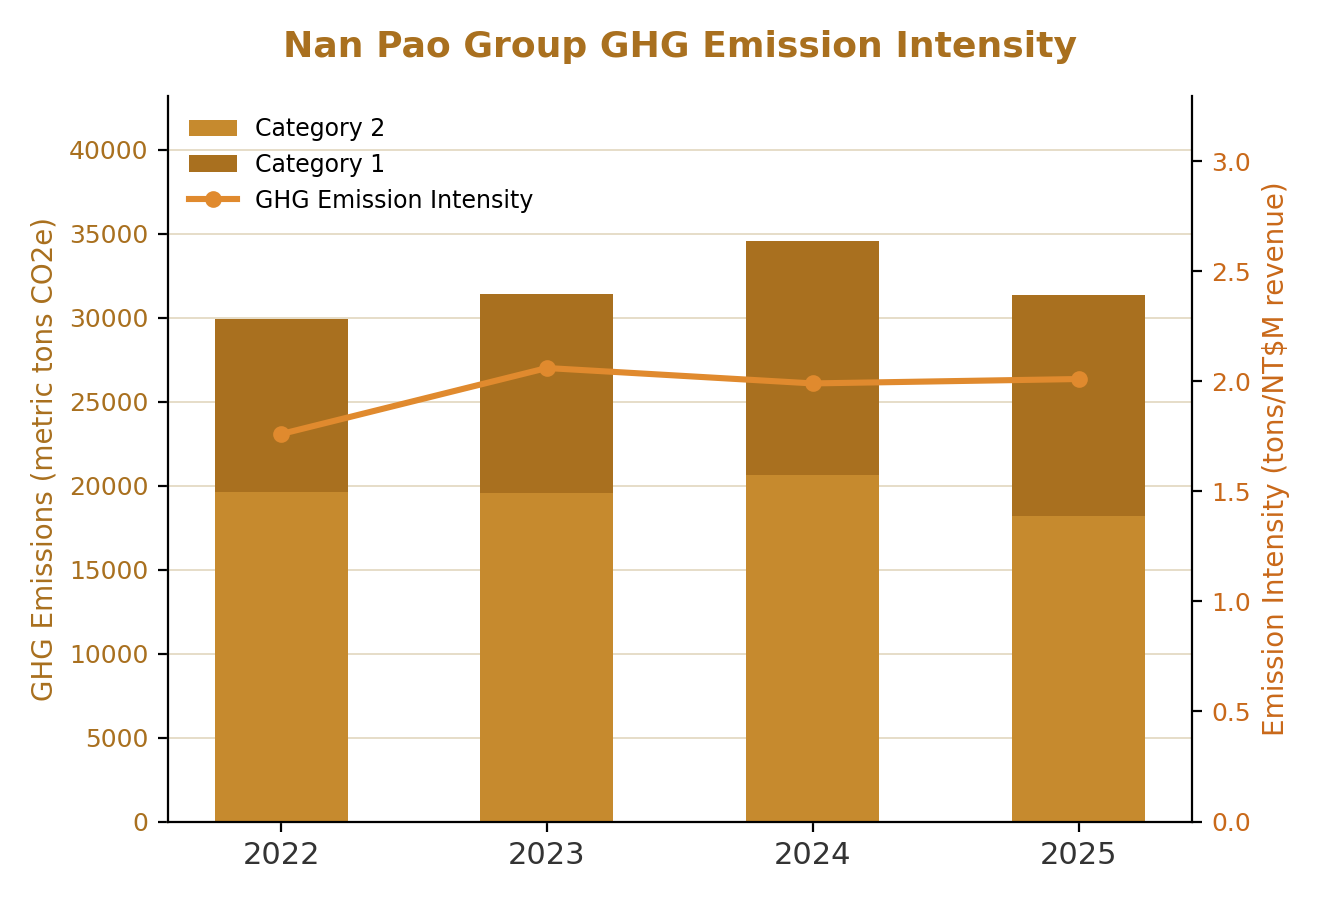
The Nan Pao Group's total Scope 1 and 2 GHG emissions in 2025 were 31,336.86 tCO₂e, an increase of 88.12 tCO₂e from 2023, mainly because growth in operating scale and sales drove higher energy and resource use. Scope 1 and 2 GHG emission intensity in 2025 was 2.01, down 2.43% from the 2023 base year, indicating that overall emission efficiency still improved as operations expanded. However, a gap remains against the annual 10% reduction target, and Nan Pao will continue to promote carbon reduction measures such as energy efficiency improvements and renewable energy adoption to progressively close the gap.
Third-party ISO 14064-1 verification statements for each Group plant are available for download below.
| Site | 2023 | 2024 | 2025 |
|---|---|---|---|
| Nan Pao Taiwan | |||
| Foshan Nan Pao | |||
| Foshan Goodwill (Advanced) | |||
| Dongguan Nan Pao | |||
| Dongguan Jiaqin | |||
| Kunshan Nan Pao | – | ||
| Fuqing Nan Pao | – | ||
| Vietnam Nan Pao | |||
| Nan Pao Advanced Materials Vietnam | |||
| Nan Pao Materials Viet Nam | |||
| Noroo-NP Paints (NNV) | – | ||
| Nan Pao Indonesia | |||
| Thailand Nan Pao | – |